Saturday 28 November 2015

COP21 Watch, pt.1: Air Pollution and Climate Change

Instead of further exploring sources of air pollution, I will use (probably) two posts to prep myself and you, my dear readers, on the upcoming COP21, especially the role of China in it. As a student of environmental sciences (or anyone who cares about this planet that we are living on), what could be a bigger and more important event other than the world coming together and negotiating a global and binding treaty to tackle climate change? Besides, this is not completely irrelevant to the main theme of this blog, which I will explain now.

Climate change and air pollution are obviously different phenomena, yet they share a common cause: anthropogenic emissions, primarily from combustion of fossil fuels, which alter the composition of the Earth’s atmosphere. In fact, some of the major air pollutants are also potent greenhouse gases, including tropospheric ozone and chlorofluorocarbons (CFCs). Nitrous oxide (N2O), a gas of high global warming potential and long atmospheric lifetime, forms NOx under high pressure. Thus,climate change and air pollution are closely coupled. Yet this coupling is complex.

First, not all types of pollutants have the same climate effect. Pollutants that are also greenhouse gases absorb and emit infrared radiation and thus warm the lower atmosphere and the Earth’s surface. The climate impact of particulate matter is, as mentioned in a previous post, in itself complex. For instance, black carbon contributes to global warming both directly by strongly absorbing solar radiation and indirectly by causing cloud burn-off and melting of ice sheet and snow cover (both of which decrease the Earth’s albedo). Sulphates, nitrates and other reflective aerosols that mainly scatter solar radiation and increase cloud albedo and lifetime (by serving as cloud condensation nuclei) have the opposite effect (NASA Earth Observaory, 2010). The blue dashed curve in the following figure illustrates the probability density function of the net aerosol radiative forcing, while the vertical lines show its 90% confidence interval. Both the lower and upper confidence limits are below 0, i.e. negative radiative forcing. The fact that this curve is wider than other ones indicates that the uncertainty increases, as more aerosol effects are taken into account.


Though from a global perspective, the overall climate effect of particulate matter is very likely to be cooling, its local to regional impacts could be different (both in terms of the sign and magnitude), depending on the relative proportions of individual components.
Another complexity is illustrated in this figure – the varying atmospheric lifetimes of pollutants, ranging from a few days, weeks and years (short-lived climate pollutants) to centuries (eg. persistent organic pollutants) and millennia (eg. CO2):

The radiative forcing of total air pollution is just as complex, if not more, as that of aerosols. This, along with other anthropogenic (eg. land use) and natural (eg. solar irradiance) radiative forcing components, drives the climate.
Kaufmann et al. (2011) studied the period between 1998 and 2008, during which the atmospheric concentration of greenhouse gases increased, but the global surface temperature indicated little warming. They found out, as shown in the following figure, the increasing anthropogenic forcing (blue line) due to rising greenhouse gas concentrations was slowed down by increasing sulphur emissions (purple line). The cooling effect of sulphur largely cancelled out the warming effect of greenhouse gases, the significance of natural forcings revealed: solar insolation (orange line) declined within its 11-year circle, amplified by increasing Southern Oscillation Index (green line) which indicated a shift from El Niño to La Niña episodes. Changes in stratospheric water vapour (another GHG) and the internal variability of the climate system were ruled out as significant factors. Kaufmann et al. (2011) attributed this rapid increase in sulphur emissions to coal consumption in Asia in general, particularly in China, whose coal consumption more than doubled during the period of study.
Source: Kaufmann et al., 2011
Changing climate may, in turn, affect air quality. The 4th IPCC report (2007) predicted “declining air quality in cities”, as climate change may alter “the dispersion rate of pollutants, the chemical environment for ozone and aerosol generation and the strength of emissions from the biosphere, fires and dust”. However, it also stated that the sign and magnitude of these impacts will vary regionally and are associated with high uncertainty.

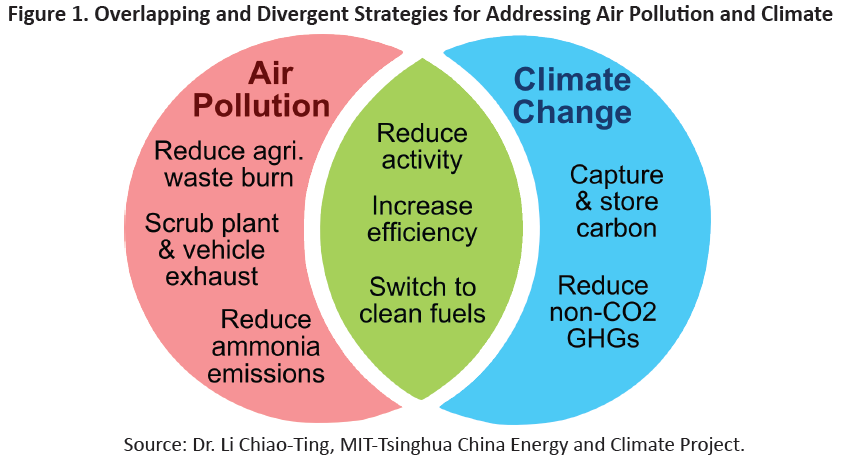
In conclusion, air pollution and climate change are correlated in complex ways (both positively and negatively) and the uncertainty of their correlations is high. Some strategies address either air pollution or climate change separately with no impact on the other, but there are also strategies which aim for co-benefits (see figure). Integrated and consistent policymaking is thus essential. So in the next few posts, I will look at both China’s pollution-control policies and climate and energy policies, especially its pledge ahead of COP21.


Sunday 22 November 2015

Tracing Back Pollution, pt.1: The Most Evil

In this and the next post, I will look at the sources of pollutants – to be more specific, the anthropogenic emissions. This figure by Zhao, Zhang and Nielson (2012) (cited in Greenpeace, 2012) illustrates China’s air pollutants emission inventory by sectors in 2010:
Source: Greenpeace, 2012.

It is evident that industry and power plants emitted most of the SO2 and NOX. As for particulate matter emissions, the proportion of residential and commercial sources was higher than that of power generation, while industry remained the largest source. As mentioned before, particulate matter does not refer to a single substance like SO2, but rather a complex mixture of particles from a wide range of sources. We differentiate between directly emitted primary particles (via fuel combustion) and secondary particles, which are produced by reactions of primary gases. Hence, the chemical composition and source apportionment of particulate matter is essential. Huang et al. (2014) investigated PM2.5 during the severe haze events in January 2013 in four cities. Their results are summarised in this figure:


Source: Huang et al., 2014.

Organic matter was the main component of PM2.5 in all four cities, followed by sulfate (8–18%), nitrate (7–14%) and ammonium (5–10%). Sulfate, nitrate and ammonium derive from the oxidation of SO2, NOX and NH3 respectively. Organic matter (OM) can be either primary or secondary; secondary OM derives from oxidation of volatile organic compounds, which can be of either biogenic or anthropogenic origin. Overall, secondary particles contributed 44-71% of OM and 30-70% of total PM2.5 (Huang et al., 2014). 

The large proportion of secondary particles reflects the significance of their precursor gases, above all SO2 and NOX, which then brings us back to their main sources: power plants and industry.

Source: U.S. Energy Information Administration, 2015.

The figure above demonstrates that coal-fired thermal power plants made up 63% of China’s installed electricity capacity in 2013. Hydropower was the second largest source of electricity generation (22%), while thermal power plants that burn natural gas or oil were less significant (4% and 2% respectively). China’s energy mix is due to its resource structure. According to World Energy Council (2013, cited in U.S. Energy Information Administration,2015), China held an approx. 126 billion short tons of proven coal reserves in 2011, which is the third largest in the world and an equivalent to 13% of the total global coal reserve. By comparison, China held 24.6 billion barrels of proven oil reserves and 164 trillion cubic feet of natural gas reserves by 2014 (Oil & Gas Journal, 2015, cited in cited in U.S. Energy Information Administration,2015), both of which did not make it to top 10 reserves in the world. Furthermore, coal is cheaper and more accessible. As a result, China is the world’s largest producer and consumer of coal, accounting for 46% of global production and 49% of global consumption—almost as much as the rest of the world combined:

Source: U.S. Energy Information Administration, 2015.


Coal is also widely consumed in energy intensive heavy industry, especially the production of iron and steel and cement. In 2014, about 49% of the world’s crude steel (World Steel Association,2015) and 57% of cement was produced in China (The European Cement Association,2015). Coal-fired industrial boilers are less efficient and thus emit more pollutants than coal-fired power plants (Greenpeace, 2012).


In summary, China’s industrialisation relies heavily on its extensive coal resource. However, coal is considered the dirtiest fossil fuel, for its extraction, processing, transportation and combustion all cause environmental damage. Coal combustion is not only the biggest source of anthropogenic CO2 emissions; it also releases many harmful by-products. According to Greenpeace (2010), it is responsible for 75% of China’s total SO2, 85% of NO2, 80% of NO and 70% of the total suspended particulate emission. Coal is the biggest source of air pollution in China.

Thursday 12 November 2015

Global Is the New Local

In the previous post, I presented the impacts of China’s air pollution on human health and the environment as well as the associated economic loss. This week, I wanted to explore some of its regional to global impacts and defend my choice of blog topic – in case you have been wondering, because the module is called “Global Environmental Change”. Air pollution is by no means a single case. China is a microcosm (not literally of course:-P) of many countries going through industrialisation and motorisation. China’s experiences and lessons in controlling air pollution are useful for other developing countries. Furthermore, pollutants emitted in China do not stay within national boundaries forever, nor do they disappear right into the thin air, instead they enter the Earth’s atmospheric circulation and can be spread around the globe. This video made by NASA shows the aerosol emission and transport from September 2006 to April 2007:


There is an evident outflow of aerosol from Eastern China towards North Pacific, which is due to the prevailing west (southwest in the Northern Hemisphere) wind in the middle latitudes. This long-range transport of air pollutants has been backed up by various studies. Oh et al. (2015) provided strong evidence that the occurrence of multi-day (>4 days) high PM10 concentration (>100 μg/m3) episodes in cold seasons from 2001 to 2013 in Seoul is correlated with the pollution emitted in Northeast China and high pressure anomalies over the region. Lin et al. (2014) calculated that on a daily basis, China’s air pollution contributed at maximum 12-24% of the sulphate, 2-5% of O3, 4-6% of CO and up to 11% of black carbon concentration over the western United States:
Source: Lin et al. (2014).

China is indeed responsible for some of the air pollution over the US. Yet, on the other hand, American consumer demand for cheap goods is what fostered the pollution in China in the first place. Lin et al. (2014) also found that production for export was responsible for 36% of SO2 emission, 27% of NOX, 22% of CO and 17% of black carbon in China in 2006. In other words, if emission were measured using the consumption-based approach, it would be much higher for many trade partners of China. For example, the US emission for SO2, NOX, CO and black carbon would be 6-19% higher in that year. This finding underlies again the global relevance of the subject matter: Outsourcing of manufacturing does not necessarily outsource the pollution as well, for pollutants can be transported and redistributed via the atmospheric circulation.

Meanwhile, China’s air pollution is likely affecting the global climate, as aerosols modify the Earth’s energy budget in two ways: either directly by absorbing solar radiation or scattering it back into space, or indirectly by influencing the formation, characteristics and dynamics of clouds:

Source:Stocker et al. (2007).

Though these aerosol-cloud interaction mechanisms are known, their magnitude is still poorly quantified. Thus the radiative forcing of aerosols contributes the largest uncertainty to the overall uncertainty in anthropogenic forcing projections (Randall et al. 2013). Using a multi-scale global aerosol-climate model, Wang et al. (2014) simulated two aerosol scenarios – one for present day and one for preindustrial level – for Northwest Pacific. The main findings are summarised in this figure:

Source: Wang et al. (2014)

Anthropogenic emission of aerosols increases the amount of cloud condensation nuclei, which results in a 108% increase of cloud droplet number concentration (A) and a 13% decrease of the cloud effective radius. Therefore, the conversion from cloud droplets to rain drops is suppressed. Consequently, the liquid water path (B) and the ice water path (C), which measure the weight of the liquid water droplets and ice water droplets in the atmosphere above a unit surface area, increases by 9.8% and 8.9 % respectively, indicating a delay in warm precipitation of low-level maritime clouds.

On the one hand, clouds reflect incoming solar radiation, thus its shortwave radiative forcing at the top of atmosphere (E) cools the Earth’s surface. It is predicted to decrease by 6.7% (2.5 W/m2). On the other hand, clouds absorb and re-emit outgoing electromagnetic radiation, hence its longwave radiative forcing (F) has a heating effect. This is predicted to increase by 6% (1.3 W/m2). The net cloud radiative forcing, which is overall negative, is thus weakened.

The fraction of high-level cloud (D) increases by 2.6%. High-level clouds have a low albedo; this is outweighed by its ability to trap outgoing heat. On the contrary, low-level clouds strongly reflect incoming sunlight. Increasing high-level cloud fraction indicates that the warming effect of clouds is strengthening, confirming the change in net cloud radiative forcing.

The response of precipitation (G) is not uniform over the region of study. Overall, it increases by 2.5 %. The transient eddy meridional heat flux (H), a measure of the poleward heat transport, which is largely carried out by mid-latitude storms, is simulated to increase by 5%. Both increased precipitation and transient eddy meridional heat flux indicate the intensification of the Pacific storm track.

In summary, air pollution in China has impacts on both regional air quality and global climate. However, China is not the only one responsible for its pollution. Of course, this is not to defend China for contaminating other countries’ air or altering the global climate, but rather to emphasise the fact that while air pollution is of local origin, it requires global solutions.  


Monday 9 November 2015

Poverty, Pollution and Population

To the public, the most sensitive issue of air pollution is undoubtedly its impacts on human health.

According to WHO (2014), SO2, NO2 and O3 all affect the respiratory system and lung functions. More health-damaging is particulate matter, which is of complex composition and varying sizes. The smaller the particles are the greater problem they pose: While lager particles are filtered in the nose and throat, PM10 can settle as far as in the bronchi and lungs. PM2.5 even gets into the alveoli, where gas exchange takes place. The smallest particles may penetrate through membranes and migrate into other organs - including the heart and the brain – via bloodstream and cause cardiovascular and cerebrovascular diseases and cancers. The composition of particulate matter depends on its source. Major components include sulphate, nitrates, ammonia, but also black carbon, which has a large surface area and adsorbs further fine carcinogens. This sarcastic animation demonstrate the journey of PM2.5 in human body:


The WHO Global Burden of Disease study estimated that ambient air pollution (PM10 pollution here specifically) caused 3.7 million premature deaths worldwide in 2012 (WHO,2014). Rohde and Muller (2015) calculated that in China, 1.6 million premature deaths per year alone can be attributed to PM2.5 pollution by adopting the WHO model which computes the mortality due to impacts of pollution on five diseases: ischemic heart disease, stroke, chronic obstructive pulmonary disease, lung cancer and acute lower respiratory infection (Burnett et al., 2014). This is equivalent to 4,000 deaths per day or 17% of all death in a year (Rohde and Muller, 2015). Another study by Yang etal. (2013) identified ambient air particulate matter pollution as the 4th leading risk factor and suggested that it caused 25,227,000 DALYs in 2010. DALY is short for disability-adjusted life year, a measure of overall disease burden as the sum of years of life lost due to disease, disability and premature death across the population (WHO, n.d.).

Air pollution also causes damage to the whole ecosystem. Though relatively well-studied, these impacts – compared to the impacts on human health – rarely enter the public discourse: Wildlife inhale health-damaging contents in the air just like humans do. SO2 and NOx are main precursors of acid rain; NOx also causes eutrophication. When deposited, they change the chemistry of soil or water bodies and further stress plants and animals. As a powerful oxidant, ground-level ozone enters plants through stomata and oxidizes plant tissue, eventually causing cell death and reducing photosynthesis. Deposition of particulate matter to vegetation surface may also interfere with photosynthesis by blocking the stomata (Grantz, Garner and Johnson, 2003).

Both human health and environmental effects of air pollution bring about economic impacts. A joint research of the StateEnvironmental Protection Administration (SEPA, predecessor of the Ministry ofEnvironmental Protection) and the World Bank (2007) stated that acid rain alone cost 30 billion RMB in crop damage and 7 billion RMB in material damage each year. The same study pointed out that based on conservative estimations, the cost of air pollution – taking both premature mortality and morbidity into account – was 157.3 billion RMB in 2003, or 1.16 % of the GDP. However, when using the willingness-to-pay measures to value premature deaths, the cost was raised to 3.8 % of the GDP, for Chinese people “value improvements in health beyond productivity gains” (SEPA and World Bank, 2007, pp. xv).

Over the last three decades, China achieved rapid economic growth and lifted 680 million people out of poverty (TheEconomist, 2013) at the expense of the environment. In recent years, the growth rate has been slowing down, while a demographic crisis is looming and the cost of environmental degradation has only just begun to appear (for most people, that is). Based on the various research results presented above, it is not hard to conclude that if air pollution were tackled efficiently, a healthier, longer living and thus more productive population would in turn boost the economy.  

Thursday 5 November 2015

The Status Quo

In the previous post, I have looked at the ambient air quality standards which regulate the types of pollutants monitored and their limit values. So naturally, the next question is: how exactly is the air quality in China?

Collecting data has not been easy. Although China has now established a large monitoring system with 1521 sites in 369 cities reporting hourly via the internet, most archived data is not publicly available. The China National Environmental Monitoring Centre (CNEMC) releases a report on air quality in 74 major cities every month since January 2013 (with the report from February 2013 and December 2014 missing). Only part of the aggregated quarterly and semi-annual reports is published and annual reports are not accessible. There are also third party observations, among which the monitoring programme by the US embassy is the best known. However, it only measures the PM2.5 concentration in 5 cities.

In this post, I will first examine the CNEMC reports and then present data from two papers for current and historical situations. The aim is to provide not an extensive review of different sources of data, but rather an overall image of the scale of air pollution in China. I will, however, continue collecting and update useful data in future posts.

In the monthly reports by CNEMC, a 74 city-average is calculated for PM2.5, PM10, NO2 and SO2 from the monthly average concentration of individual cities (for CO and O3 a 74 city-average is not calculated):
Data source: China National Environmental Monitoring Centre.

As can be seen from the diagram, all four pollutants demonstrate seasonal patterns. I will get back on this when I write about the causes of air pollution in China. At this point, what we are most interested in is probably an annual average and how far it is below or above the limit. As data for February 2013 and December 2014 are missing, data from March 2013 to February 2014 are taken to calculate the annual average:


annual average
g/m3)
annual average limit
(class 2) g/m3)
PM2.5
70
35
PM10
116
70
NO2
44
40
SO2
38
60
Data source: China National Environmental Monitoring Centre.


The annual average concentration of all pollutants except SO2 exceeds the corresponding limit, among which that of two sizes of particulate matter lie far beyond.   

Due to lack of aggregated data, Rohde andMuller (2015) collect real-time (hourly) data during a four month period from April to August 2014 and apply Kriging interpolation to derive pollution maps for Eastern China (east of 95°E, which includes 97% of the population), as little monitoring is done in Western China. The following figure presents the average concentration of PM2.5, PM10 and O3 during the study period for Eastern China (top) and the Beijing to Shanghai corridor (bottom), which contains the highest concentrations and major sources of pollution. The colour coding is not based on the Chinese, but the US EPA AQI categories:
                                                Source: Rohde & Muller (2015).  

For PM2.5 concentration, areas containing approx. 38% of the population are classified as “unhealthy” (>55.5 μg/m3). Another 45% of the population is living in areas classified as “unhealthy for sensitive groups” (>35.5 μg/m3). PM10 concentration shows similar but less severe patterns, with most of China averaging “moderate” (>150 μg/m3). Ozone concentration level is “good” for most of China, except for some Northeastern cities.

These two maps for SO2 and NO2 show “good” levels throughout the country:


 Source: Rohde & Muller (2015). 

As the first figure shows, the air pollution in China is most severe during winter months and modest from late summer to early fall. This study period from April to August lies somewhere in between; hence the concentration values should be similar to or slightly lower than the long-term average.

The next two diagrams illustrate annual concentration of pollutants in 31 major cities from 1995 to 2009 based on official yearbook data. The pollutants measured are particulate matter (total suspended particulates (TSP) until 2000, PM10 thereafter), SO2 and nitrogen oxides (NOx until 1999, NO2 thereafter). As can been seen from these graphs, the level of SO2 concentration declined consistently from 1995 to 2009, with steep drop prior to 2000. By contrast, PM10 level decreased only slightly since 2003 and NO2 concentration remained stable during this time period.


In short, air pollution is extensive in China and affects the majority of the population. Pollution of particulate matter is most severe with average concentrations exceeding both domestic and international standards.