Saturday 26 December 2015

War on Pollution, pt.1: A Chronicle of Legislation and Policies

China’s environmental law system first established with the passage of the Environmental Protection Law (for Trial Implementation, 1979). In 1987, the Air Pollution Prevention and Control Law (APPCL) was promulgated. It was then revised twice in 1995 and 2000. The APPCL 2000 focused on regulating SO2 and coarse particles emissions (Feng and Liao, 2015; Zhao, n.d.).

In addition to legislation, prevention and control of air pollution has also been embodied in state development plans developed every five years, a system inherited from the former Soviet Union and a relic of the planned economy era. The plans originally focused on economic development only, yet in recent years, much attention has also been given to social development and environmental protection (The Economist, 2015). The 10th five-year plan (2000-2005) included emissions reduction targets for the first time: 10% reduction of SO2 emissions from the 2000 level by 2005. The target was repeated in the the 11th five-year plan, as it failed during the previous period (Schreifels et al., 2012; cited in Saikawa, 2014). To meet this goal, flue gas desulfurisation was highly promoted in thermal power plants, experiencing a growth from 12% in 2005 to 82% in 2010. As a result, SO2 emissions decreased by 29% despite the 50% increase in coal consumption in the energy sector (Wang et al., 2012). The 12th five-year plan (2011-2015) included, apart from targets on further reduction of SO2 emissions (8% below 2010 levels), targets on NOx emissions reduction (10%) and carbon intensity reduction (17%) for the first time (Saikawa, 2014). Much hope has been placed on similar end-of-pipe technologies such as selective catalytic reduction and selective noncatalytic reduction (both are denitrification methods) (Wang et al., 2012).

It is also during the implementation period of this five-year plan that air pollution has became a major concern among Chinese people. It all started with the widespread of hourly air quality reports by the US Embassy in Beijing on Chinese internet, as the reading of PM2.5 concentrations went “beyond index” (IAQI>500) in November 2010 for the first time since monitoring established in 2008 (The New York Times, 2013).

Mounting public concern fuelled new policies. In 2012, the first standards for PM2.5 concentrations were approved (see a previous post). In the same year, a five-year plan specifically devoted to improving air quality in three key regions and ten city clusters was issued: the 12th Five-year Plan on Air Pollution Prevention and Control in Key Regions (click here for full text; English version). The plan set binding ambient concentration targets for SO2, NO2, PM10 and PM2.5 for the first time as well as more ambitious emissions reduction targets than the national targets. It also introduced concrete measures in detailed projects (Clean Air Alliance China, 2014). 

In 2013 the government further announced the Action Plan on Prevention and Control of Air Pollution (click here for full text; English version) with stricter standards, higher targets and concrete timetables, summarised in the following figure. Key points are:

a) to reduce urban concentrations of PM10 by 10% by 2017 on the 2012 levels nationwide and concentrations of PM2.5 by 25%, 20% and 10% in three key regions Beijing-Tianjin-Hebei, Yangtze River Delta and the Pearl River Delta respectively; 
b) to decrease the share of coal in total energy consumption to below 65% from around 67% in 2012 (Finamore, 2013) and increase the coal washing rate to above 70% by 2017, to prohibit the approval of new coal-fired power plants and to peak and decline coal consumption in three key regions;
c) to provide National Stage V gasoline and diesel and eliminate “yellow-label” vehicles (old, high-emitting vehicles that fall under China I emission standard (gasoline) or China III emission standard (diesel)) by no later than 2017;
d) to complete the backward productivity elimination target required in the “12th Five-Year Plan” one year ahead (by 2014) in iron and steel, cement, electrolytic aluminum, glass etc. 21 key industries and to eliminate another 15 million tons of backward productivity in iron making, 15 million tons in steel making, 100 million tons in cement and 20 million weight cases of glass in 2015.


To provide legal basis for the action plan, the revised APPCL was passed in this August and will enter into force in Jan 1, 2016. Major amendments include the first acknowledgement of the cost of air pollution on public health, a new framework for regional air quality management and coordination (emphasis on the responsibility of local governments) (Cai and Tang, 2015), an alert system on bad weather conditions that worsen smog as well as regulations on emissions from shipping (Liu, 2015).

The post provides an overview of China’s legislative framework and current policies to tackle air pollution. Next time, we will examine these critically and discuss further possible strategies.  


Sunday 20 December 2015

COP21 Watch, pt.3: A Small Step For a Giant Leap(?)

It has been a week since COP21 ended and I finally have time to finish this serie. For recap, some of the best moments are summarised in this ten-minute video by UNFCCC:


The closing remarks were all emotional and optimistic - a historic agreement to combat climate change and promote sustainable development has been reached by 195 nations (click here for full text). Its main objectives are described in Article 2:

“a) Holding the increase in the global average temperature to well below 2 °C above pre-industrial levels and to pursue efforts to limit the temperature increase to 1.5 °C above pre-industrial levels, recognizing that this would significantly reduce the risks and impacts of climate change;
b) Increasing the ability to adapt to the adverse impacts of climate change and foster climate resilience and low greenhouse gas emissions development, in a manner that does not threaten food production; 
c)Making finance flows consistent with a pathway towards low greenhouse gas emissions and climate- resilient development. “

Moreover, in Article 4, it resolves to “reach global peaking of greenhouse gas emissions as soon as possible” and, after 2050, anthropogenic emissions should be balanced by “removals by sinks”. 

The Paris agreement is the first universal agreement on climate, for its predecessor the Kyoto Protocol, which had been extended to 2020, contains binding emissions reduction targets for industrialised countries (Annex I countries) only. It is also an ambitious agreement, as it aims for limiting global warming to well below 2 °C, or even below 1.5 °C and reaching climate neutrality by the second half of this century. 

The fact that there is an agreement is already a triumph, and it is a collective triumph of the past several COPs. However, it is still too early to celebrate. 

First of all, the Paris agreement is not yet legally binding. It will be if at least 55 countries which together represent 55% of the world’s greenhouse gas emissions ratify it during a one year period starting 22 April, 2016. Even if the agreement becomes legally binding, there are no legally binding emissions reduction targets per se, unlike the Kyoto Protocol, only Intended Nationally Determined Contributions (INDCs). This relates back to COP15 in 2009 in Copenhagen, which failed because of the attempt of imposing legally binding targets were strongly objected by some parties (BBC, 2015). Also there will be no enforcement mechanisms: a country is not enforced to communicate its INDCs by a specific date, nor will it be sanctioned when failed to comply. Furthermore, even if all parties fully implement their current pledges and policies of similar strength were adopted after 2030, we are still far from reaching the below-2 °C target, let alone below-1.5 °C. Climate Action Tracker (2015) predicted a median warming of 2.7 °C (range: 2.2-3.4 °C) by 2100. 
Source: Climate Action Tracker, 2015.


On the good side, the agreement does announce that the first global stocktake of the implementation will take place in 2023 and every five years thereafter (Article 14) and successive plans ought to be more ambitious than the previous one (Article 3).

In a word, the Paris Agreement itself does not solve global warming, but it sets the ground floor for higher ambition. And we, as citizens, should urge politicians to comply their current and future INDCs. Some of my readers have raised the question of whether China will be able to achieve its INDCs. S join me next time, as I will finally study China’s energy policies. 

Tuesday 15 December 2015

Tracing Back Pollution, pt.3: A Growing Risk

In the first two posts from this serie, we have looked at air pollutants emissions from power plants, industry as well as residential and commercial sources. There is only one sector left in this familiar figure, namely transport:


Whilst SO2 and particulate matter emissions from the transport sector seem minimal (5% or less), it is an important source of NOx and CO, also volatile organic compounds (VOC). The share of vehicle emissions is higher in urban areas, especially in large cities. A study by Guan and Liu (2013) indicated that the transport sector is the largest source of NOx and the second largest source of total air pollution in Beijing (following the energy sector). Beijing has been shutting down and relocating factories since before the Olympics in 2008, yet car ownership is still rising despite restrictions on new license plates. It is expected to exceed 6 million in 2016 (Xinhua, 2012). 
Source: Guan and Liu, 2013.

Overall, car ownership reached 154 million in China in 2014, the second highest in the world next to the US. However, the ownership per capita was still only a fraction of that of the US, with only 113 vehicles per 1000 person (Xinhua, 2014). The world’s largest automative market expanded at a compounded rate of 24% per year between 2005 and 2011 and still has substantial growth potential. McKinsey predicted an average annual growth rate of 8% till 2020 (Huang, Liu and Hein, 2013). Thus, the share of the transport sector in air pollutants emissions is very likely to increase as well.

Large gross vehicle ownership is causing traffic congestions in many cities (see the following figure), which may further worsen air quality. Vehicles burn the most fuel while accelerating to get up to speed (Environmental Leader, 2012), thus constant accelerating and braking exhausts more pollutants. According to Song (2014), PM2.5 concentrations are more than 3 times higher during rush hours than during off-peak hours on Beijing’s West 2nd Ring road.

Another factor that needs to be considered is the emission standards. China’s current nationwide light-duty emission standard China IV is nearly identical to the Euro 4 standard in terms of limit values, which was phased out in Europe in 2009. The new China 5 standard with an implementation date of 1 Jan 2018 is almost equivalent to the Euro 5 standard, which had been replaced by Euro 6 standard last year. The emission standards for heavy-duty vehicles also follows their European precedents, with a delay of 7-8 years (Transport policy, 2015). Lower standards are linked to higher emissions. And the Volkswagen scandal has raised the question of how much should we trust manufacturers’ environmental claims (and also claims on safety?).

In conclusion, though currently less significant than other sectors, given the ongoing expansion of the automotive market and loose emission standards, the transport sector is likely to contribute more to air pollution in the future.


Thursday 10 December 2015

Tracing Back Pollution, pt.2: Winter Heating and Air Pollution

It’s finally time for the much-delayed Part 2, in which I will continue examining the sources of air pollution. First, let’s review China’s emission inventory by sectors:

Residential and commercial sources are the second largest source of particulate matter, which is usually the primary pollutant (refers to the pollutant with the highest IAQI, not the origin!) in most Chinese cities (see real-time air quality ranking and a previous post) and the most heath-damaging (see another previous post). Therefore, same as in part 1, we will now look at residential energy consumption in China.

Source: Zheng et al., 2014.

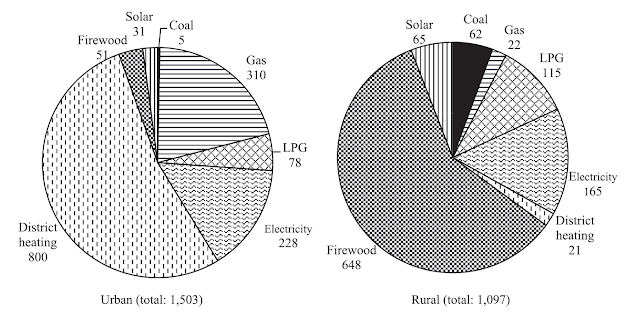
The figure above depicts the energy flow for a typical Chinese household in 2012. This is the outcome of a survey by Zheng et al. (2014), derived from 1450 households in 26 provinces, with 80% from urban areas and 20% from rural areas. According to the chart, district heating is the most important energy source, which supplies 45% of the total energy need. Accordingly, spatial heating is the most energy-intensive end-use, accounting for 54% of the total energy consumption. Spatial heating is mostly fuelled by district heating, but also firewood, electricity and gas.

Apart from the small sample size, a major shortcoming of this survey is the small proportion of rural households. In 2012, 48% of the total population in China lived in rural areas (World Bank, n. d.). Hence, rural households are under-represented in the national average. Recognising this fact, Zheng et al. (2014) also examined the energy use of urban and rural households separately:

Source: Zheng et al., 2014.


The two pie charts on the top illustrate energy consumption by energy type, while energy consumption by end-use is shown on the bottom. A main difference is that district heating accounted for 56% of the total energy need in urban households, but only 2% in rural households. By contrast, the proportion of spatial heating in total energy consumption is not significantly different (56% and 40% respectively). 


Winter heating system was established in China between 1950 and 1980. The heating was free during the planned economy period and is still heavily subsidised today. Due to budgetary limitations, it was only entitled to cities north of Huai River/Qinling Mountains (see the following figure), which roughly follows the 0 degree isotherm in January, from November to March. Central heating was (and largely remains) non-existent in southern cities and rural areas until recent years (Almond et al., 2009). Therefore, if Zheng et al. (2014) distinguished between northern and southern China, there would also be a gap in the energy consumption by energy type.
Source: Zhang, Liu and Li, 2014

Based on the abundance of coal compared to oil and natural gas, it is reasonable to assume that China’s heating system relies heavily on coal. Indeed heat is mostly generated by coal-fired heat-only boilers or combined heat and power generators, then sent to households through pipelines. Coal-fired boilers are less efficient than oil, gas or electricity heating systems and substantial energy is lost during transport. Moreover, the incomplete combustion of coal releases several air pollutants, including SO2, NOX and particulate matter (Almond et al., 2009). Almond et al. (2009) studied the relationship between a city’s TSP concentrations and its latitude. In the following figure, each black dot represents a city’s annual mean TSP concentration averaged over 1981 and 1993, while the vertical line represents the Huai River/Qinling Mountains line (33◦N). It is evident that northern cities with winter heating have higher TSP concentrations. More convincing is the discontinuous increase in TSP concentrations at latitudes just above the Huai River/Qinling Mountains line. Because other factors that influence air quality do not vary abruptly around this line, Almond et al. concluded that the heating policy has led to higher pollution levels in northern China.
Source: Almond et al., 2009.


Winter heating is also largely responsible for the seasonal variation in pollution concentrations revealed in a previous post. Xiao et al. (2015) adjusted aerosol optical depth (AOD, a measure of the loss of light due to aerosols on a vertical path through the atmosphere) to reflect ground-level PM2.5 concentrations in China. Their main findings are summarised in this figure:

Source: Xiao et al., 2015.

As shown in the graph, PM2.5 loadings were consistently higher during heating seasons than during non-heating seasons, both in heating areas in the North and non-heating areas in the South. During heating seasons, the mean AOD was about three times higher in heating areas than in non-heating areas. Whereas during non-heating seasons, the average AOD was only slightly higher in heating areas than in non-heating areas. This is due to the different energy structure: Southern China relies more on electricity and oil than northern China, as most coal resources are located in the north and north-west (Xiao et al., 2015).


We've started off at residential and commercial energy consumption, which then led us to central winter heating and, finally back to coal. Residential source is the second biggest source for particulate matter pollution in China. Among residential and commercial energy consumption, heating is a major component. Because of the over-reliance on coal, heating causes significantly higher pollution levels in the winter and especially in northern China.


There have been calls for providing central heating for southern cities, because for cities just south of the Huai River/Qinling Mountains line, for example Nanjing and Shanghai, the winter is just as cold and uncomfortable. If this were to be implemented, coal-fired boilers would certainly not be the optimal choice.   

Friday 4 December 2015

COP21 Watch, pt.2: What to Expect

In 2009 in Copenhagen (COP15), the countries agreed on keeping the increase in global mean temperature below 2 degree Celsius by 2100 at the latest, as IPCC predicted that surpassing this limit would cause serious consequences. This is equivalent to stabilising the greenhouse gas concentrations at about 445 to 490 ppm CO2-equivalents (EEA, 2011), which means that we need to reduce emissions by 40-70% by 2050 and eventually achieve zero-emissions by 2100 (COP21, n.d.).

Also on that COP, it was decided that each party of the UNFCCC would communicate their intended actions to reduce greenhouse gas emissions under a new universal and binding agreement (Intended Nationally Determined Contributions, INDC) ahead of COP21. To achieve such an agreement after years of negotiations, which would enter into force in 2020, is the objective of COP 21.

According to the Emissions Database for Global Atmospheric Research (EDGAR, a joint project of the European Commission Joint Research Centre and the Netherlands Environmental Assessment Agency), China overtook US as the world’s largest CO2 emitter in 2005. Last year, China’s emissions made up nearly 30% of the global emissions. China’s per capita CO2 emission, though ranked significantly lower, is rising rapidly as well. In 2012, it surpassed the per capita of the EU, while accounting for only 1/3 of it in 2000. Hence, China plays a critical role in mitigating climate change globally. 

So now let’s take a look at China’s intended contributions by 2030. The key points are summarised as follows:
  1. To peak CO2 emissions no later than 2030 ;
  2. To reduce CO2 emissions per unit of GDP by 60-65% over the 2005 level;
  3. To  increase the share of non-fossil fuels in primary energy consumption to approx. 20%;
  4. To increase the forest stock volume by around 4.5 billion cubic meters on the 2005 level.

Furthermore, China will establish a national Emissions Trading Scheme, having been experimenting with seven regional pilot carbon trading markets. It also pledges to establish a fund for South-South cooperation on climate change, but will not contribute to the Green Climate Fund (GCF), a mechanism within the framework of UNFCCC to support developing countries in mitigating and adapting climate change. Aiming to mobilise 100 billion USD per year by 2020, the Green Climate Fund has raised 10.2 billion from 38 countries (including some developing countries!) as of November 2015(GCF, 2015). 

China’s commitments, except the carbon intensity target(ratio of CO2 emissions to GDP) have been rated by the Climate Action Tracker (CAT) as medium (light grey shade in the following figure), i.e. they are “in the least stringent part of the 2 degree range” (CAT, 2015). If all countries adopted this position, warming would likely exceed 2 degree. The carbon intensity target of 60-65% reduction, however, is considered inconsistent with other targets. If implemented in insolation, it would lead to 1.6-3.3 Gt more CO2 emissions in 2030 (dark grey shade). CAT thus rated this single target as inadequate and suggested a 70% reduction instead to close the gap (CAT, 2015).
Source: CAT, 2015.

So besides China, what to expect of other countries? According to a synthesis report by UNFCCC (2015), which is based on the INDCs of 147 parties (75% of all parties and 86% of the global greenhouse gas emissions in 2010) submitted by 1 October 2015, the aggregated effect does not look optimistic:
Source: UNFCCC, 2015.

The figure above predicts the global emission levels resulting from the implementation of INDCs in 2025 and 2030 (yellow bars) and compare these with the business-as-usual scenario (red) and enhanced mitigation scenarios for a least-cost trajectory to keep the warming below 2 degree (starting today in dark blue, by 2020 in medium blue and by 2030 in light blue). It is evident that the estimated emission levels do not fall within those 2 degree scenario levels. In fact, it would be higher by 8.7 Gt CO2 equivalent in 2025 and by 15.1 Gt in 2030 (UNFCCC, 2015).

I understand that this outcome is partially due to negotiation strategies - You do not want to play your best cards too early. Thus, five days into COP21, with intense negotiations running at this very moment, I would like to quote François Hollande from his speech on the Leaders Event as closing remarks (the quote has been reformulated by Christiana Figueres, the Executive Secretary of UNFCCC):

“The greatest threat is not that we aim too high and miss. The greatest danger is that we aim too low and only do that.”

And hopefully, the next time I write about COP21, it would sound a bit less depressing. 


Saturday 28 November 2015

COP21 Watch, pt.1: Air Pollution and Climate Change

Instead of further exploring sources of air pollution, I will use (probably) two posts to prep myself and you, my dear readers, on the upcoming COP21, especially the role of China in it. As a student of environmental sciences (or anyone who cares about this planet that we are living on), what could be a bigger and more important event other than the world coming together and negotiating a global and binding treaty to tackle climate change? Besides, this is not completely irrelevant to the main theme of this blog, which I will explain now.

Climate change and air pollution are obviously different phenomena, yet they share a common cause: anthropogenic emissions, primarily from combustion of fossil fuels, which alter the composition of the Earth’s atmosphere. In fact, some of the major air pollutants are also potent greenhouse gases, including tropospheric ozone and chlorofluorocarbons (CFCs). Nitrous oxide (N2O), a gas of high global warming potential and long atmospheric lifetime, forms NOx under high pressure. Thus,climate change and air pollution are closely coupled. Yet this coupling is complex.

First, not all types of pollutants have the same climate effect. Pollutants that are also greenhouse gases absorb and emit infrared radiation and thus warm the lower atmosphere and the Earth’s surface. The climate impact of particulate matter is, as mentioned in a previous post, in itself complex. For instance, black carbon contributes to global warming both directly by strongly absorbing solar radiation and indirectly by causing cloud burn-off and melting of ice sheet and snow cover (both of which decrease the Earth’s albedo). Sulphates, nitrates and other reflective aerosols that mainly scatter solar radiation and increase cloud albedo and lifetime (by serving as cloud condensation nuclei) have the opposite effect (NASA Earth Observaory, 2010). The blue dashed curve in the following figure illustrates the probability density function of the net aerosol radiative forcing, while the vertical lines show its 90% confidence interval. Both the lower and upper confidence limits are below 0, i.e. negative radiative forcing. The fact that this curve is wider than other ones indicates that the uncertainty increases, as more aerosol effects are taken into account.


Though from a global perspective, the overall climate effect of particulate matter is very likely to be cooling, its local to regional impacts could be different (both in terms of the sign and magnitude), depending on the relative proportions of individual components.
Another complexity is illustrated in this figure – the varying atmospheric lifetimes of pollutants, ranging from a few days, weeks and years (short-lived climate pollutants) to centuries (eg. persistent organic pollutants) and millennia (eg. CO2):

The radiative forcing of total air pollution is just as complex, if not more, as that of aerosols. This, along with other anthropogenic (eg. land use) and natural (eg. solar irradiance) radiative forcing components, drives the climate.
Kaufmann et al. (2011) studied the period between 1998 and 2008, during which the atmospheric concentration of greenhouse gases increased, but the global surface temperature indicated little warming. They found out, as shown in the following figure, the increasing anthropogenic forcing (blue line) due to rising greenhouse gas concentrations was slowed down by increasing sulphur emissions (purple line). The cooling effect of sulphur largely cancelled out the warming effect of greenhouse gases, the significance of natural forcings revealed: solar insolation (orange line) declined within its 11-year circle, amplified by increasing Southern Oscillation Index (green line) which indicated a shift from El Niño to La Niña episodes. Changes in stratospheric water vapour (another GHG) and the internal variability of the climate system were ruled out as significant factors. Kaufmann et al. (2011) attributed this rapid increase in sulphur emissions to coal consumption in Asia in general, particularly in China, whose coal consumption more than doubled during the period of study.
Source: Kaufmann et al., 2011
Changing climate may, in turn, affect air quality. The 4th IPCC report (2007) predicted “declining air quality in cities”, as climate change may alter “the dispersion rate of pollutants, the chemical environment for ozone and aerosol generation and the strength of emissions from the biosphere, fires and dust”. However, it also stated that the sign and magnitude of these impacts will vary regionally and are associated with high uncertainty.

In conclusion, air pollution and climate change are correlated in complex ways (both positively and negatively) and the uncertainty of their correlations is high. Some strategies address either air pollution or climate change separately with no impact on the other, but there are also strategies which aim for co-benefits (see figure). Integrated and consistent policymaking is thus essential. So in the next few posts, I will look at both China’s pollution-control policies and climate and energy policies, especially its pledge ahead of COP21.


Sunday 22 November 2015

Tracing Back Pollution, pt.1: The Most Evil

In this and the next post, I will look at the sources of pollutants – to be more specific, the anthropogenic emissions. This figure by Zhao, Zhang and Nielson (2012) (cited in Greenpeace, 2012) illustrates China’s air pollutants emission inventory by sectors in 2010:
Source: Greenpeace, 2012.

It is evident that industry and power plants emitted most of the SO2 and NOX. As for particulate matter emissions, the proportion of residential and commercial sources was higher than that of power generation, while industry remained the largest source. As mentioned before, particulate matter does not refer to a single substance like SO2, but rather a complex mixture of particles from a wide range of sources. We differentiate between directly emitted primary particles (via fuel combustion) and secondary particles, which are produced by reactions of primary gases. Hence, the chemical composition and source apportionment of particulate matter is essential. Huang et al. (2014) investigated PM2.5 during the severe haze events in January 2013 in four cities. Their results are summarised in this figure:


Source: Huang et al., 2014.

Organic matter was the main component of PM2.5 in all four cities, followed by sulfate (8–18%), nitrate (7–14%) and ammonium (5–10%). Sulfate, nitrate and ammonium derive from the oxidation of SO2, NOX and NH3 respectively. Organic matter (OM) can be either primary or secondary; secondary OM derives from oxidation of volatile organic compounds, which can be of either biogenic or anthropogenic origin. Overall, secondary particles contributed 44-71% of OM and 30-70% of total PM2.5 (Huang et al., 2014). 

The large proportion of secondary particles reflects the significance of their precursor gases, above all SO2 and NOX, which then brings us back to their main sources: power plants and industry.

Source: U.S. Energy Information Administration, 2015.

The figure above demonstrates that coal-fired thermal power plants made up 63% of China’s installed electricity capacity in 2013. Hydropower was the second largest source of electricity generation (22%), while thermal power plants that burn natural gas or oil were less significant (4% and 2% respectively). China’s energy mix is due to its resource structure. According to World Energy Council (2013, cited in U.S. Energy Information Administration,2015), China held an approx. 126 billion short tons of proven coal reserves in 2011, which is the third largest in the world and an equivalent to 13% of the total global coal reserve. By comparison, China held 24.6 billion barrels of proven oil reserves and 164 trillion cubic feet of natural gas reserves by 2014 (Oil & Gas Journal, 2015, cited in cited in U.S. Energy Information Administration,2015), both of which did not make it to top 10 reserves in the world. Furthermore, coal is cheaper and more accessible. As a result, China is the world’s largest producer and consumer of coal, accounting for 46% of global production and 49% of global consumption—almost as much as the rest of the world combined:

Source: U.S. Energy Information Administration, 2015.


Coal is also widely consumed in energy intensive heavy industry, especially the production of iron and steel and cement. In 2014, about 49% of the world’s crude steel (World Steel Association,2015) and 57% of cement was produced in China (The European Cement Association,2015). Coal-fired industrial boilers are less efficient and thus emit more pollutants than coal-fired power plants (Greenpeace, 2012).


In summary, China’s industrialisation relies heavily on its extensive coal resource. However, coal is considered the dirtiest fossil fuel, for its extraction, processing, transportation and combustion all cause environmental damage. Coal combustion is not only the biggest source of anthropogenic CO2 emissions; it also releases many harmful by-products. According to Greenpeace (2010), it is responsible for 75% of China’s total SO2, 85% of NO2, 80% of NO and 70% of the total suspended particulate emission. Coal is the biggest source of air pollution in China.

Thursday 12 November 2015

Global Is the New Local

In the previous post, I presented the impacts of China’s air pollution on human health and the environment as well as the associated economic loss. This week, I wanted to explore some of its regional to global impacts and defend my choice of blog topic – in case you have been wondering, because the module is called “Global Environmental Change”. Air pollution is by no means a single case. China is a microcosm (not literally of course:-P) of many countries going through industrialisation and motorisation. China’s experiences and lessons in controlling air pollution are useful for other developing countries. Furthermore, pollutants emitted in China do not stay within national boundaries forever, nor do they disappear right into the thin air, instead they enter the Earth’s atmospheric circulation and can be spread around the globe. This video made by NASA shows the aerosol emission and transport from September 2006 to April 2007:


There is an evident outflow of aerosol from Eastern China towards North Pacific, which is due to the prevailing west (southwest in the Northern Hemisphere) wind in the middle latitudes. This long-range transport of air pollutants has been backed up by various studies. Oh et al. (2015) provided strong evidence that the occurrence of multi-day (>4 days) high PM10 concentration (>100 μg/m3) episodes in cold seasons from 2001 to 2013 in Seoul is correlated with the pollution emitted in Northeast China and high pressure anomalies over the region. Lin et al. (2014) calculated that on a daily basis, China’s air pollution contributed at maximum 12-24% of the sulphate, 2-5% of O3, 4-6% of CO and up to 11% of black carbon concentration over the western United States:
Source: Lin et al. (2014).

China is indeed responsible for some of the air pollution over the US. Yet, on the other hand, American consumer demand for cheap goods is what fostered the pollution in China in the first place. Lin et al. (2014) also found that production for export was responsible for 36% of SO2 emission, 27% of NOX, 22% of CO and 17% of black carbon in China in 2006. In other words, if emission were measured using the consumption-based approach, it would be much higher for many trade partners of China. For example, the US emission for SO2, NOX, CO and black carbon would be 6-19% higher in that year. This finding underlies again the global relevance of the subject matter: Outsourcing of manufacturing does not necessarily outsource the pollution as well, for pollutants can be transported and redistributed via the atmospheric circulation.

Meanwhile, China’s air pollution is likely affecting the global climate, as aerosols modify the Earth’s energy budget in two ways: either directly by absorbing solar radiation or scattering it back into space, or indirectly by influencing the formation, characteristics and dynamics of clouds:

Source:Stocker et al. (2007).

Though these aerosol-cloud interaction mechanisms are known, their magnitude is still poorly quantified. Thus the radiative forcing of aerosols contributes the largest uncertainty to the overall uncertainty in anthropogenic forcing projections (Randall et al. 2013). Using a multi-scale global aerosol-climate model, Wang et al. (2014) simulated two aerosol scenarios – one for present day and one for preindustrial level – for Northwest Pacific. The main findings are summarised in this figure:

Source: Wang et al. (2014)

Anthropogenic emission of aerosols increases the amount of cloud condensation nuclei, which results in a 108% increase of cloud droplet number concentration (A) and a 13% decrease of the cloud effective radius. Therefore, the conversion from cloud droplets to rain drops is suppressed. Consequently, the liquid water path (B) and the ice water path (C), which measure the weight of the liquid water droplets and ice water droplets in the atmosphere above a unit surface area, increases by 9.8% and 8.9 % respectively, indicating a delay in warm precipitation of low-level maritime clouds.

On the one hand, clouds reflect incoming solar radiation, thus its shortwave radiative forcing at the top of atmosphere (E) cools the Earth’s surface. It is predicted to decrease by 6.7% (2.5 W/m2). On the other hand, clouds absorb and re-emit outgoing electromagnetic radiation, hence its longwave radiative forcing (F) has a heating effect. This is predicted to increase by 6% (1.3 W/m2). The net cloud radiative forcing, which is overall negative, is thus weakened.

The fraction of high-level cloud (D) increases by 2.6%. High-level clouds have a low albedo; this is outweighed by its ability to trap outgoing heat. On the contrary, low-level clouds strongly reflect incoming sunlight. Increasing high-level cloud fraction indicates that the warming effect of clouds is strengthening, confirming the change in net cloud radiative forcing.

The response of precipitation (G) is not uniform over the region of study. Overall, it increases by 2.5 %. The transient eddy meridional heat flux (H), a measure of the poleward heat transport, which is largely carried out by mid-latitude storms, is simulated to increase by 5%. Both increased precipitation and transient eddy meridional heat flux indicate the intensification of the Pacific storm track.

In summary, air pollution in China has impacts on both regional air quality and global climate. However, China is not the only one responsible for its pollution. Of course, this is not to defend China for contaminating other countries’ air or altering the global climate, but rather to emphasise the fact that while air pollution is of local origin, it requires global solutions.