In the previous post, I presented the
impacts of China’s air pollution on human health and the environment as well as
the associated economic loss. This week, I wanted to explore some of its
regional to global impacts and defend my choice of blog topic – in case you
have been wondering, because the module is called “Global Environmental Change”.
Air pollution is by no means a single case. China is a microcosm (not literally
of course:-P) of many countries going through industrialisation and motorisation.
China’s experiences and lessons in controlling air pollution are useful for
other developing countries. Furthermore, pollutants emitted in China do not
stay within national boundaries forever, nor do they disappear right into the
thin air, instead they enter the Earth’s atmospheric circulation and can be
spread around the globe. This video made by NASA shows the aerosol emission and
transport from September 2006 to April 2007:
There is an evident outflow of aerosol from
Eastern China towards North Pacific, which is due to the prevailing west
(southwest in the Northern Hemisphere) wind in the middle latitudes. This
long-range transport of air pollutants has been backed up by various studies. Oh et al. (2015) provided strong evidence that the occurrence of multi-day (>4
days) high PM10 concentration (>100 μg/m3)
episodes in cold seasons from 2001 to 2013 in Seoul is correlated with the pollution
emitted in Northeast China and high pressure anomalies over the region. Lin et al. (2014) calculated that on a daily basis, China’s air pollution contributed at
maximum 12-24% of the sulphate, 2-5% of O3, 4-6% of CO and up to
11% of black carbon concentration over the western United States:
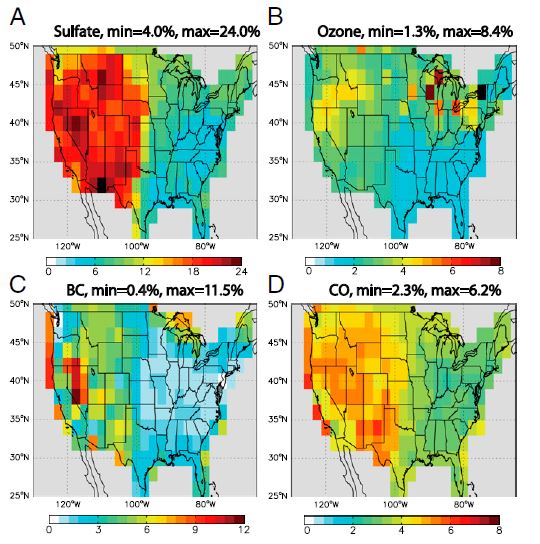
Source: Lin et al. (2014).
China is indeed responsible for some of the
air pollution over the US. Yet, on the other hand, American consumer demand for
cheap goods is what fostered the pollution in China in the first place. Lin et al. (2014) also found that production for export was responsible for 36% of SO2
emission, 27% of NOX, 22% of CO and 17% of black carbon in
China in 2006. In other words, if emission were measured using the
consumption-based approach, it would be much higher for many trade partners of
China. For example, the US emission for SO2, NOX,
CO and black carbon would be 6-19% higher in that year. This finding
underlies again the global relevance of the subject matter: Outsourcing of manufacturing
does not necessarily outsource the pollution as well, for pollutants can be
transported and redistributed via the atmospheric circulation.
Meanwhile, China’s air pollution is likely
affecting the global climate, as aerosols modify the Earth’s energy budget in
two ways: either directly by absorbing solar radiation or scattering it back
into space, or indirectly by influencing the formation, characteristics and
dynamics of clouds:
 Source:Stocker et al. (2007).
Though these aerosol-cloud interaction
mechanisms are known, their magnitude is still poorly quantified. Thus the
radiative forcing of aerosols contributes the largest uncertainty to the
overall uncertainty in anthropogenic forcing projections (Randall et al. 2013).
Using a multi-scale global aerosol-climate model, Wang et al. (2014) simulated
two aerosol scenarios – one for present day and one for preindustrial level –
for Northwest Pacific. The main findings are summarised in this figure:

Source: Wang et al. (2014)
Anthropogenic emission of aerosols
increases the amount of cloud condensation nuclei, which results in a 108%
increase of cloud droplet number concentration (A) and a 13% decrease of the
cloud effective radius. Therefore, the conversion from cloud droplets to rain
drops is suppressed. Consequently, the liquid water path (B) and the ice water
path (C), which measure the weight of the liquid water droplets and ice water
droplets in the atmosphere above a unit surface area, increases by 9.8% and 8.9
% respectively, indicating a delay in warm precipitation of low-level maritime
clouds.
On the one hand, clouds reflect incoming
solar radiation, thus its shortwave radiative forcing at the top of atmosphere
(E) cools the Earth’s surface. It is predicted to decrease by 6.7% (2.5 W/m2).
On the other hand, clouds absorb and re-emit outgoing electromagnetic radiation,
hence its longwave radiative forcing (F) has a heating effect. This is
predicted to increase by 6% (1.3 W/m2). The net cloud radiative
forcing, which is overall negative, is thus weakened.
The fraction of high-level cloud (D)
increases by 2.6%. High-level clouds have a low albedo; this is outweighed by
its ability to trap outgoing heat. On the contrary, low-level clouds strongly
reflect incoming sunlight. Increasing high-level cloud fraction indicates that
the warming effect of clouds is strengthening, confirming the change in net
cloud radiative forcing.
The response of precipitation (G) is not
uniform over the region of study. Overall, it increases by 2.5 %. The transient
eddy meridional heat flux (H), a measure of the poleward heat transport, which
is largely carried out by mid-latitude storms, is simulated to increase by 5%.
Both increased precipitation and transient eddy meridional heat flux indicate
the intensification of the Pacific storm track.
No comments:
Post a Comment