It’s finally time for the much-delayed Part 2, in which I will continue examining the sources of air pollution. First, let’s review China’s emission inventory by sectors:

Source: Greenpeace, 2012.
Residential and commercial sources are the second largest source of particulate matter, which is usually the primary pollutant (refers to the pollutant with the highest IAQI, not the origin!) in most Chinese cities (see real-time air quality ranking and a previous post) and the most heath-damaging (see another previous post). Therefore, same as in part 1, we will now look at residential energy consumption in China.
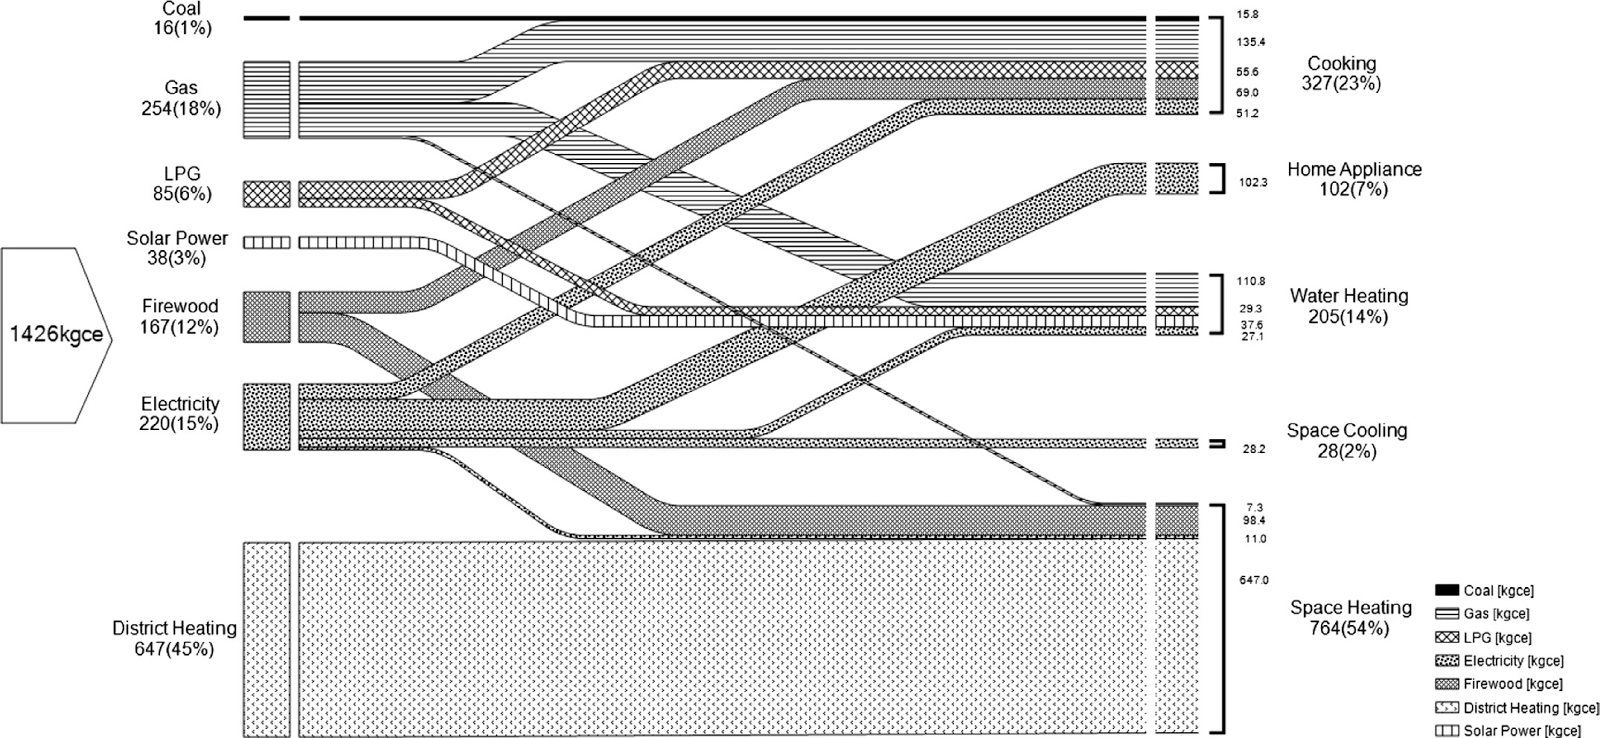
Source: Zheng et al., 2014.
The figure above depicts the energy flow for a typical Chinese household in 2012. This is the outcome of a survey by Zheng et al. (2014), derived from 1450 households in 26 provinces, with 80% from urban areas and 20% from rural areas. According to the chart, district heating is the most important energy source, which supplies 45% of the total energy need. Accordingly, spatial heating is the most energy-intensive end-use, accounting for 54% of the total energy consumption. Spatial heating is mostly fuelled by district heating, but also firewood, electricity and gas.
Apart from the small sample size, a major shortcoming of this survey is the small proportion of rural households. In 2012, 48% of the total population in China lived in rural areas (World Bank, n. d.). Hence, rural households are under-represented in the national average. Recognising this fact, Zheng et al. (2014) also examined the energy use of urban and rural households separately:
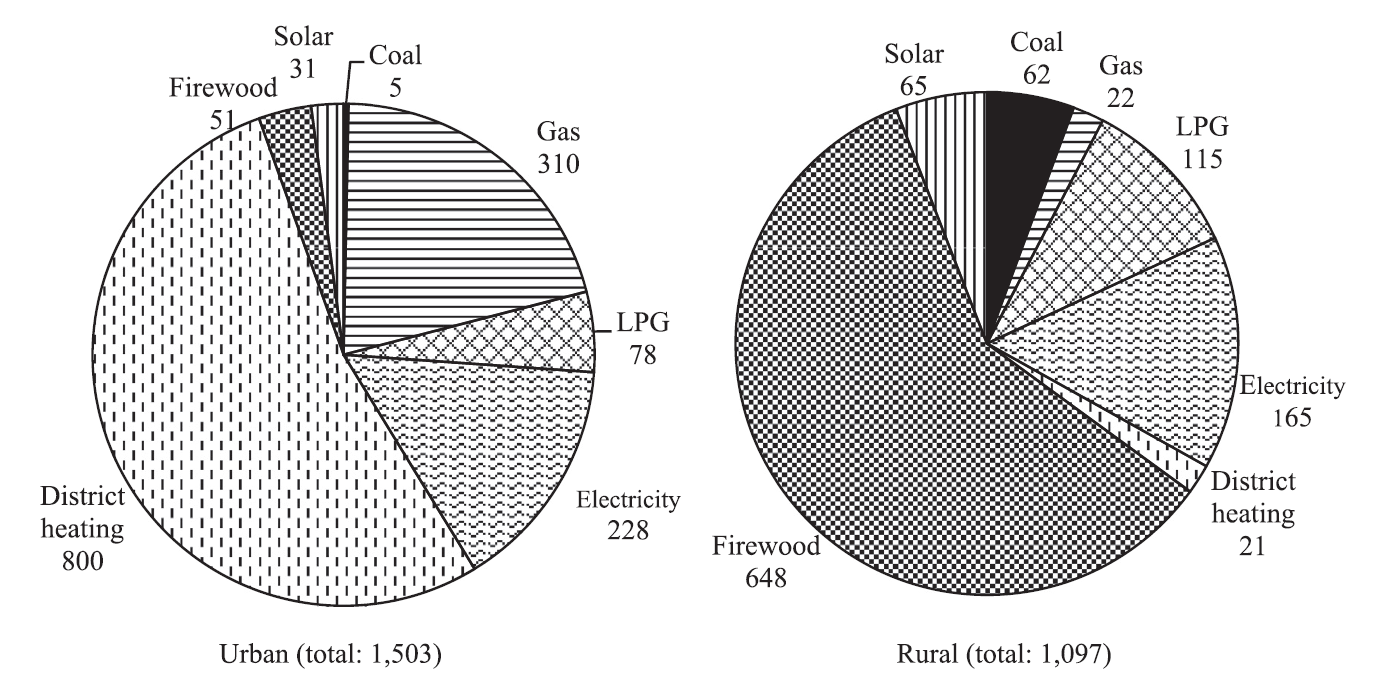

Source: Zheng et al., 2014.
The two pie charts on the top illustrate energy consumption by energy type, while energy consumption by end-use is shown on the bottom. A main difference is that district heating accounted for 56% of the total energy need in urban households, but only 2% in rural households. By contrast, the proportion of spatial heating in total energy consumption is not significantly different (56% and 40% respectively).
Winter heating system was established in China between 1950 and 1980. The heating was free during the planned economy period and is still heavily subsidised today. Due to budgetary limitations, it was only entitled to cities north of Huai River/Qinling Mountains (see the following figure), which roughly follows the 0 degree isotherm in January, from November to March. Central heating was (and largely remains) non-existent in southern cities and rural areas until recent years (Almond et al., 2009). Therefore, if Zheng et al. (2014) distinguished between northern and southern China, there would also be a gap in the energy consumption by energy type.

Source: Zhang, Liu and Li, 2014
Based on the abundance of coal compared to oil and natural gas, it is reasonable to assume that China’s heating system relies heavily on coal. Indeed heat is mostly generated by coal-fired heat-only boilers or combined heat and power generators, then sent to households through pipelines. Coal-fired boilers are less efficient than oil, gas or electricity heating systems and substantial energy is lost during transport. Moreover, the incomplete combustion of coal releases several air pollutants, including SO2, NOX and particulate matter (Almond et al., 2009). Almond et al. (2009) studied the relationship between a city’s TSP concentrations and its latitude. In the following figure, each black dot represents a city’s annual mean TSP concentration averaged over 1981 and 1993, while the vertical line represents the Huai River/Qinling Mountains line (33◦N). It is evident that northern cities with winter heating have higher TSP concentrations. More convincing is the discontinuous increase in TSP concentrations at latitudes just above the Huai River/Qinling Mountains line. Because other factors that influence air quality do not vary abruptly around this line, Almond et al. concluded that the heating policy has led to higher pollution levels in northern China.

Source: Almond et al., 2009.
Winter heating is also largely responsible for the seasonal variation in pollution concentrations revealed in a previous post. Xiao et al. (2015) adjusted aerosol optical depth (AOD, a measure of the loss of light due to aerosols on a vertical path through the atmosphere) to reflect ground-level PM2.5 concentrations in China. Their main findings are summarised in this figure:

Source: Xiao et al., 2015.
As shown in the graph, PM2.5 loadings were consistently higher during heating seasons than during non-heating seasons, both in heating areas in the North and non-heating areas in the South. During heating seasons, the mean AOD was about three times higher in heating areas than in non-heating areas. Whereas during non-heating seasons, the average AOD was only slightly higher in heating areas than in non-heating areas. This is due to the different energy structure: Southern China relies more on electricity and oil than northern China, as most coal resources are located in the north and north-west (Xiao et al., 2015).
We've started off at residential and commercial energy consumption, which then led us to central winter heating and, finally back to coal. Residential source is the second biggest source for particulate matter pollution in China. Among residential and commercial energy consumption, heating is a major component. Because of the over-reliance on coal, heating causes significantly higher pollution levels in the winter and especially in northern China.
There have been calls for providing central heating for southern cities, because for cities just south of the Huai River/Qinling Mountains line, for example Nanjing and Shanghai, the winter is just as cold and uncomfortable. If this were to be implemented, coal-fired boilers would certainly not be the optimal choice.
No comments:
Post a Comment